In this module we continued looking at the parts of the computer, how they work, and how all of that can affect performance of applications. We were given sample code that we had to optimise based on our knowledge of how the hardware work.
>SHOT 1:
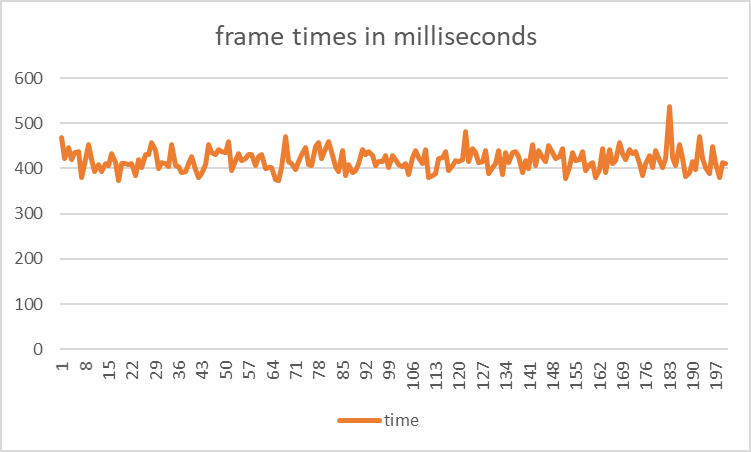
Initial speed:
(uni computer)
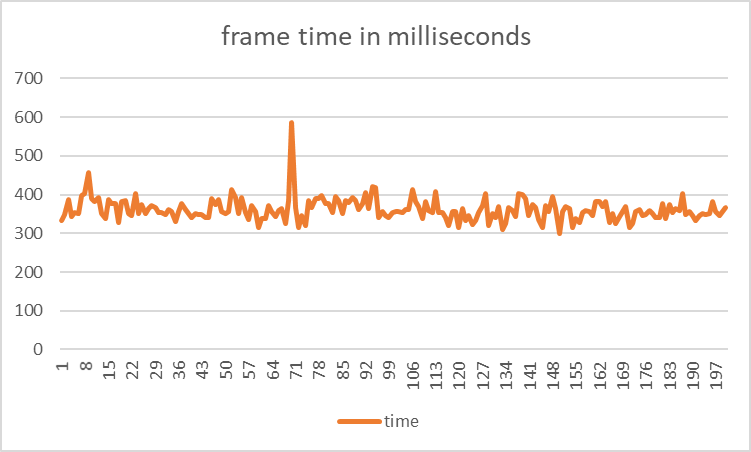
Ignoring the first 50 frames to allow the cache to warm up and avoid miscellaneous numbers, the following 200 frames ran at an average of 418.745 milliseconds or per frame.
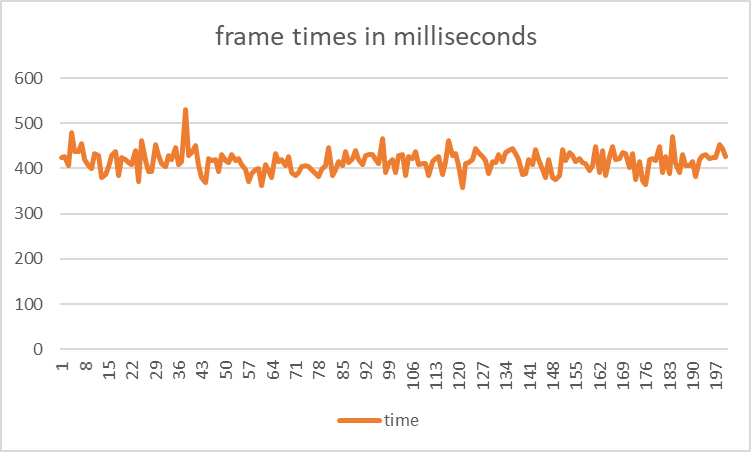
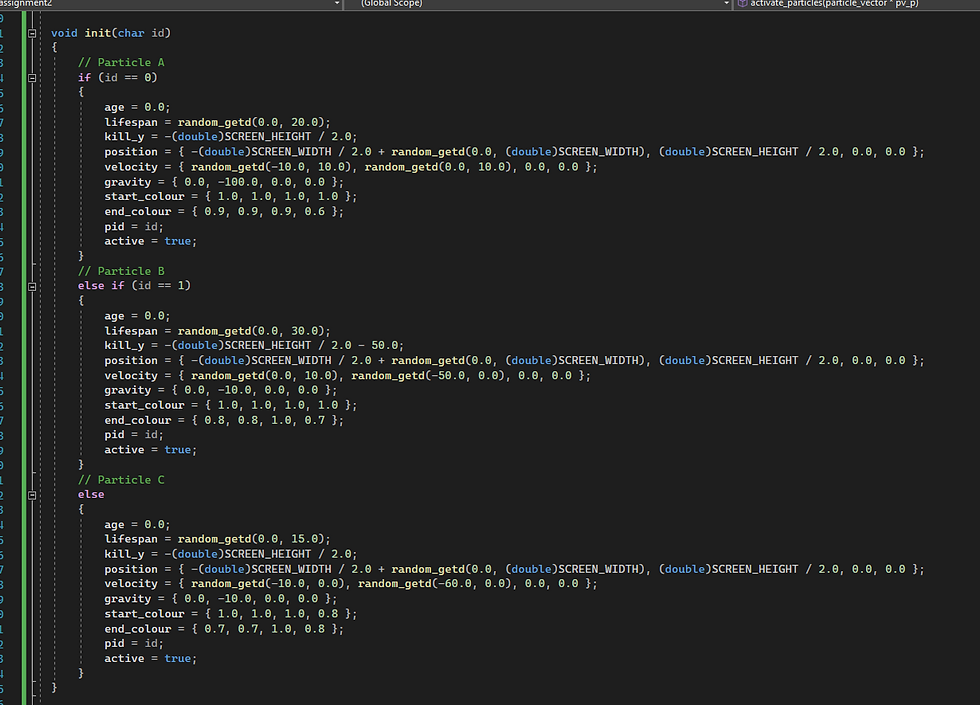
After replacing the string identifiers for different types with an enum class to eliminate string comparisons,
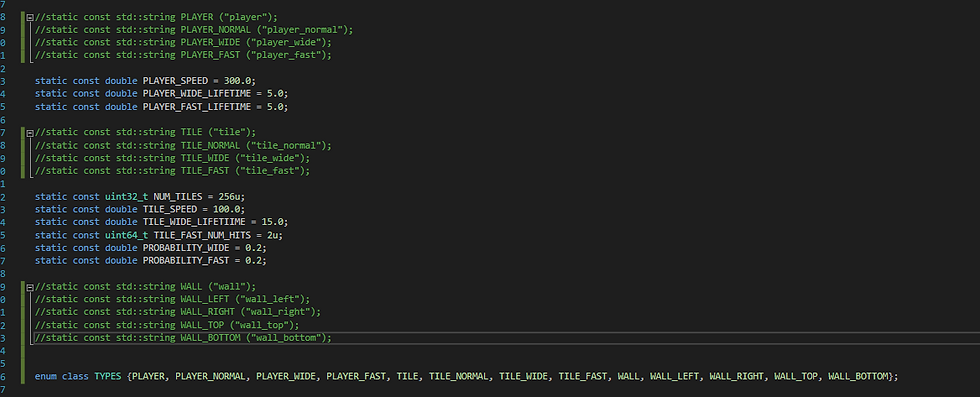
The average frame time decreased to an average of 415.485 - an improvement of 0.78%.
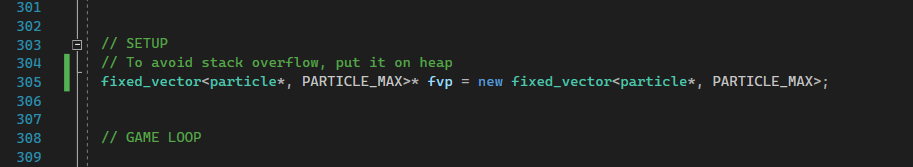
Next I wanted to get rid of the run-time dynamic memory allocation. I achieved this by creating a virtual base class game object, which the tiles and player inherit from. This allows me to use polymorphism, so I can just pass base class pointers to functions, such as collision detection. As a result, virtual functions are called which execute the appropriate code for each object.
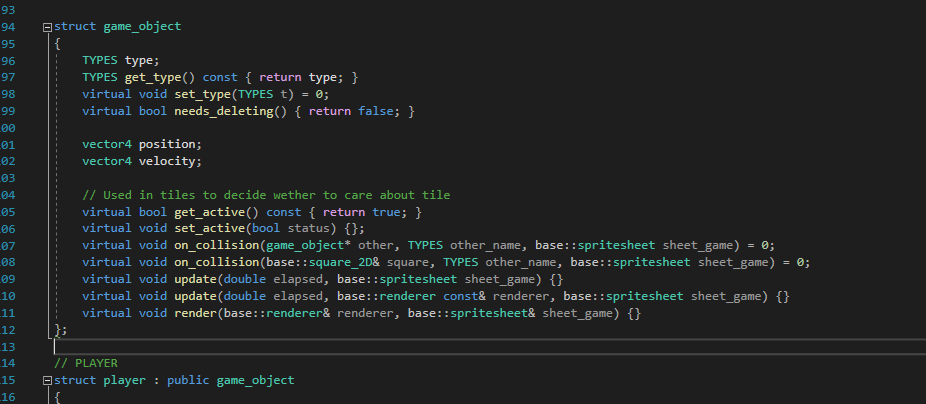
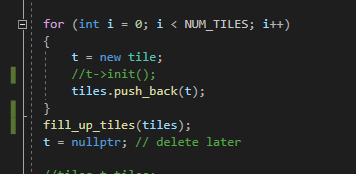
While there is still one instance of dynamic memory allocation, it happens when the program first starts, making it negligible when considering perfor
mance. This reduces the average frametime to 361.27 ms, which is an improvement of 15%.
The next step of optimisation was Data Oriented Design. I put every game object in one class, of which there was only one instance in the game.
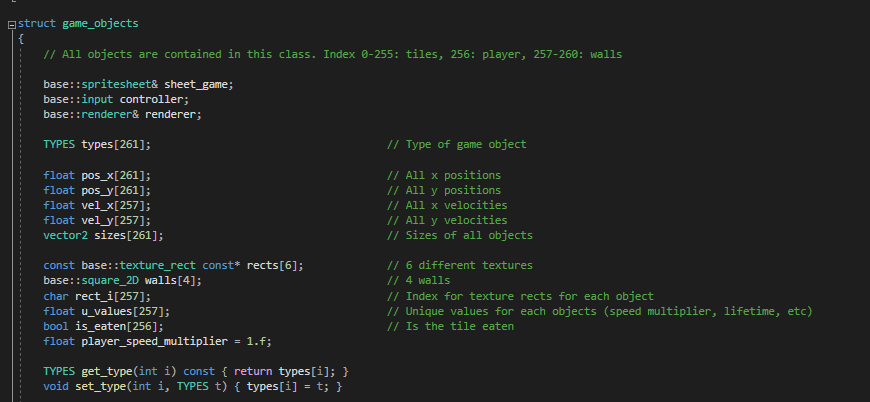
In this class, I also changed the representation of velocities and positions to floats from doubles, to reduce the amount of memory required. In this arrangement, all elements of the game are next to each other in memory, so reading and writing speeds are reduced a substantial amount.
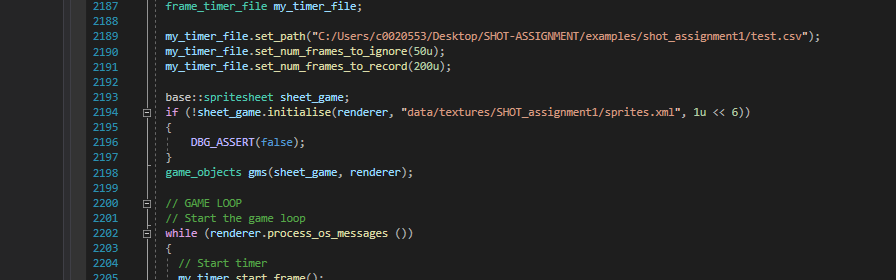
Furthermore, I also moved the initialisation and releasing of the sheet_game out of the main game loop, so now it’s not done every frame, but once respectively.
These techniques greatly improved performance:
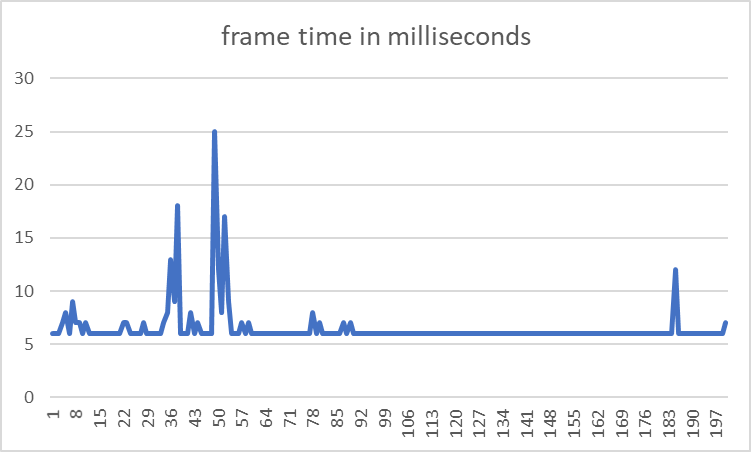
Average frame time: 6.475 ms. This is an improvement of 98%.
Next I did Single Instruction Multiple Data:

Performance:
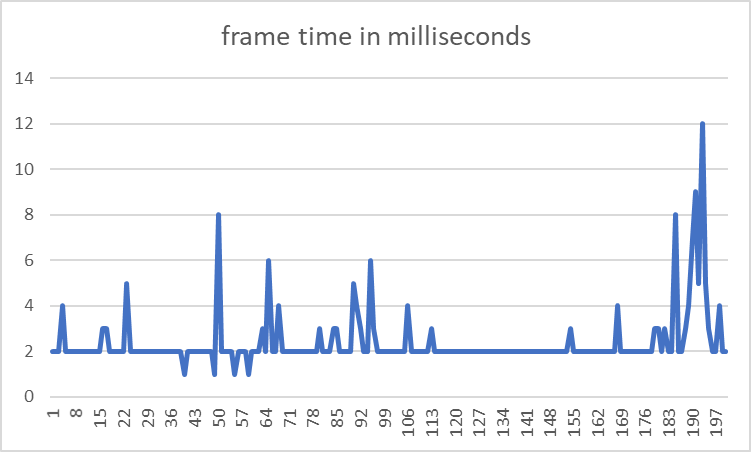
This makes the average frame time 2.395 milliseconds. From the initial time this is 99.52% more optimised.
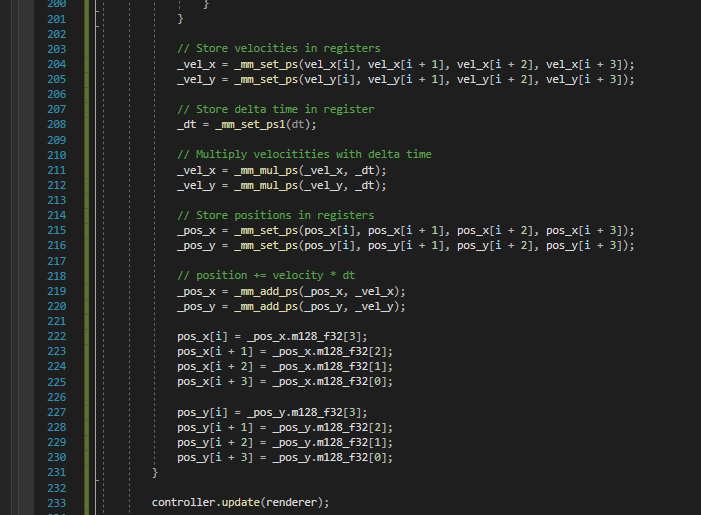
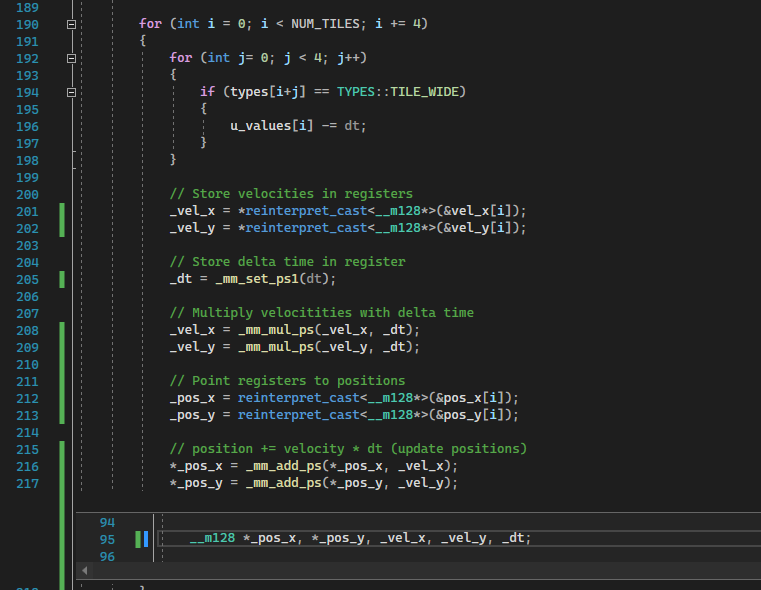
Once all of this was finished I read through the code and made some minor changes to further optimise the code:
>SHOT 2:
This project was benchmarked on my home PC
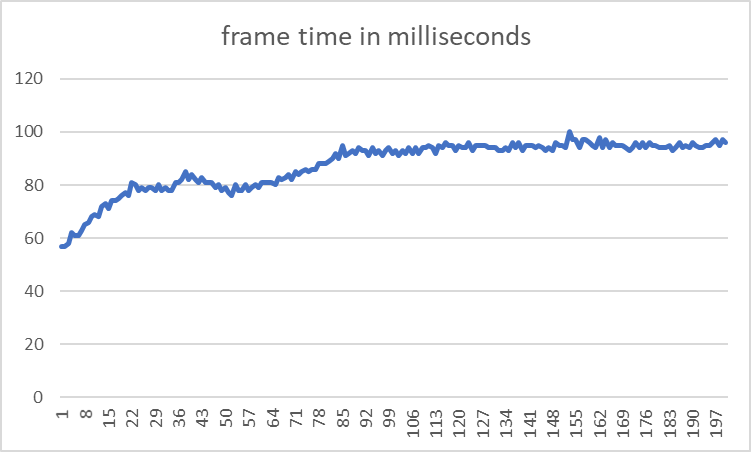
Average frame time: 87.595ms
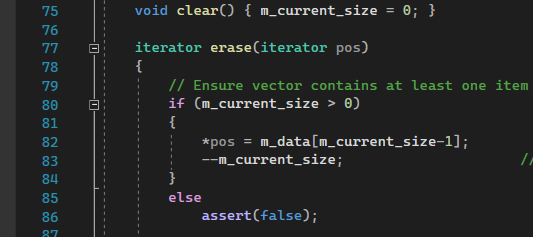
First I implemented the fixed vector class, which i modified to be more effective.
In the erase function, when erasing an element, instead of shifting all elements down and returning the iterator to the next element, i copy the last element of the array into the position to be erased, then decrease the current size.
The performance after these changes:
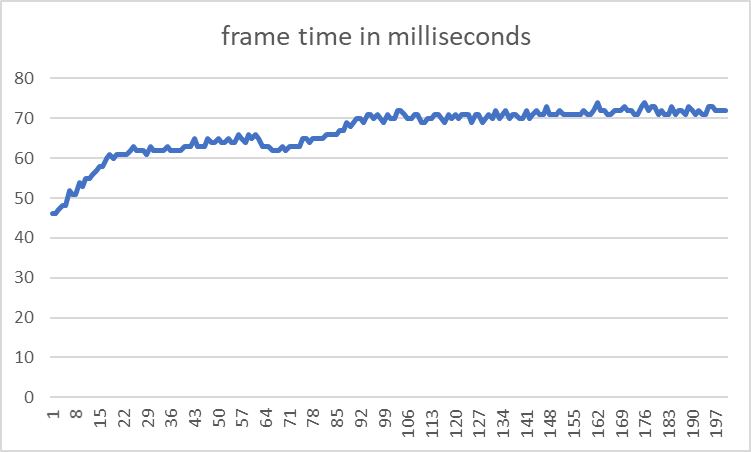
Average frame time: 66.845 millisecond per frame.
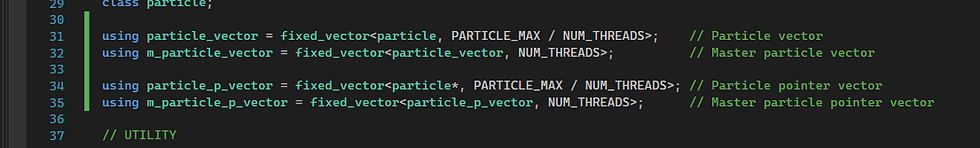
Next i started working on multithreading. To avoid typing out confusing identifiers, i added some aliases to the file:

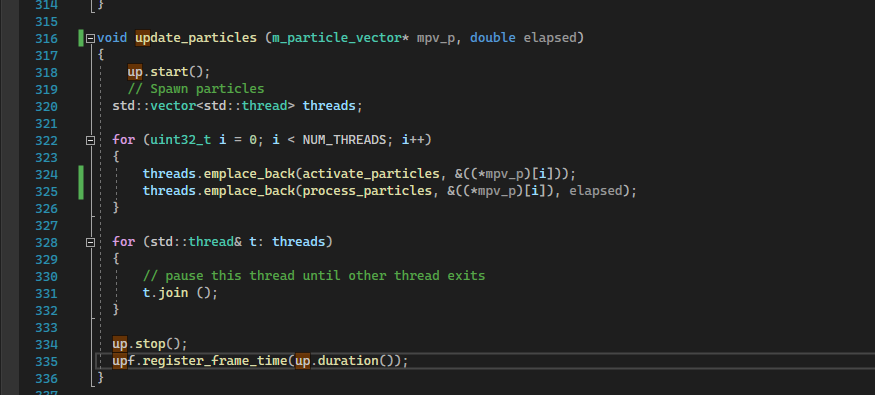
Update particles became this:
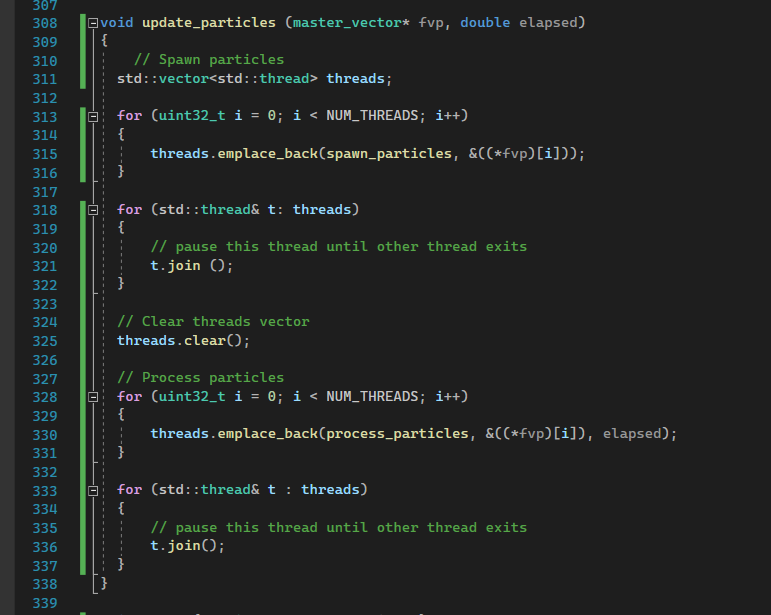
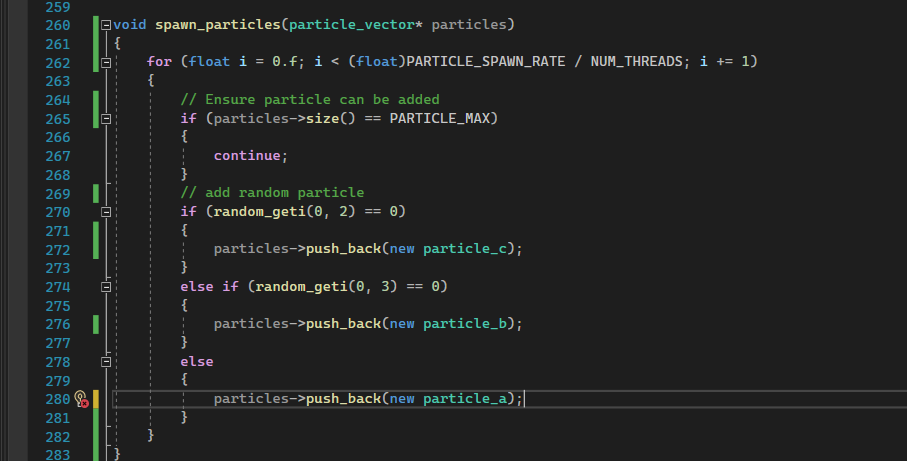
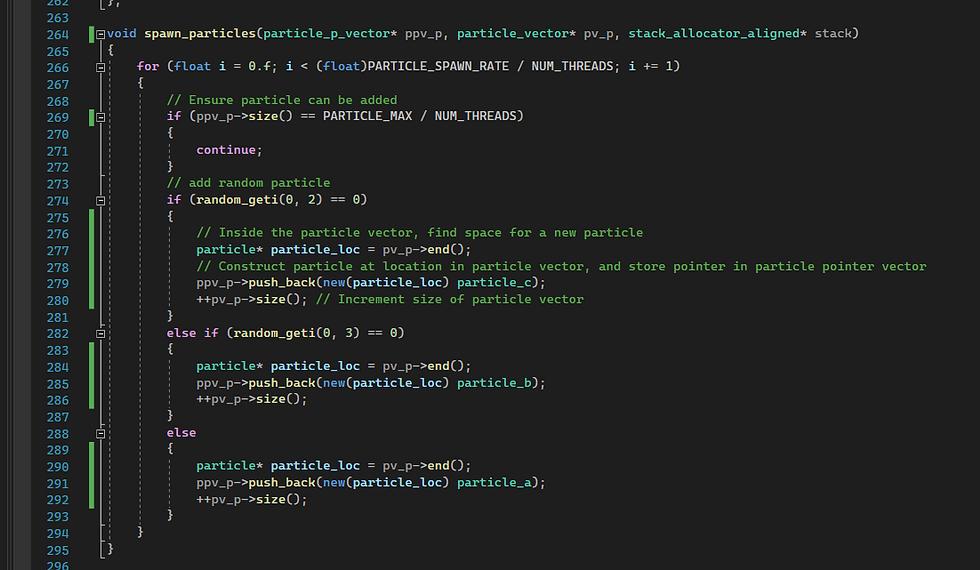
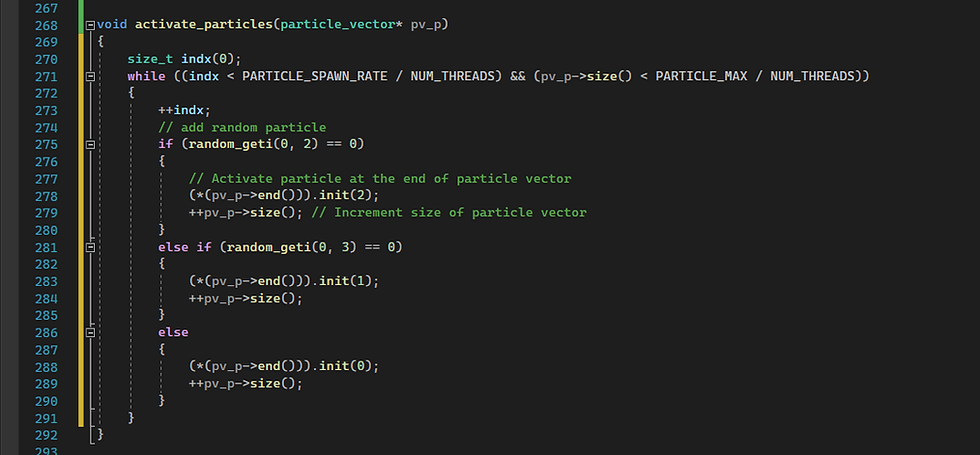
With spawn particles:
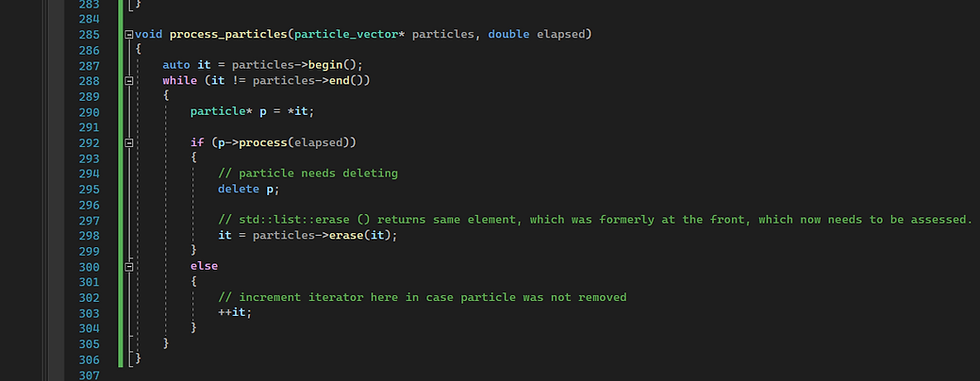
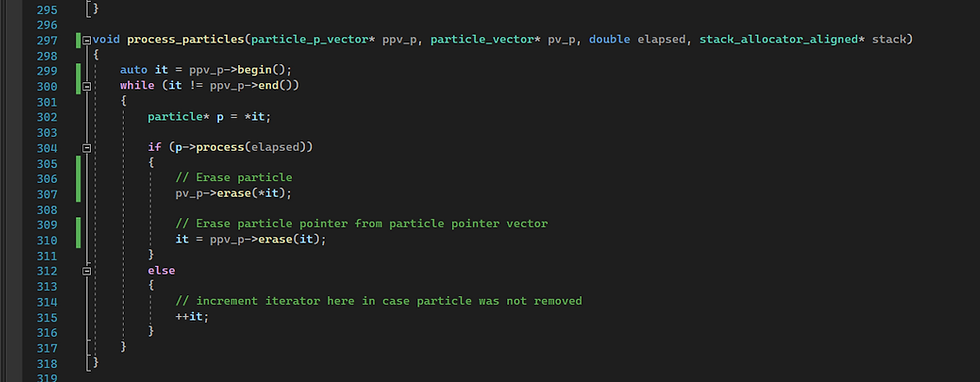
And process particles:
With just 1 thread performance was 77.115 ms per frame.
With 2 threads: 71.265
With 4 threads: 69.79
With 8 threads: 72.275
This clearly indicates that the bottleneck becomes the speed at which the program receives dynamically allocated memory. This can potentially be solved with our own memory allocator.
The new stack contains one vector of num threads vectors containing particle pointers and one vector containing num threads vectors containing the actual particles like so:
To be able to create a vector of base class particles i altered the virtual function so the class is no longer abstract:
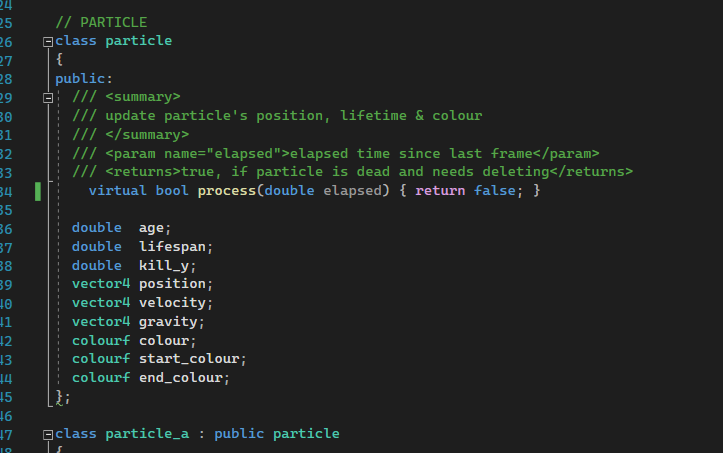
Memory allocation works by fining space for a particle in a particle vector, passing that address to the new placement, and storing the pointer to it in the vector of particle pointers like so:
Similarly with erase:
The result is a rather chaotic performance which alternates between around 45 and 95 milliseconds between frames:
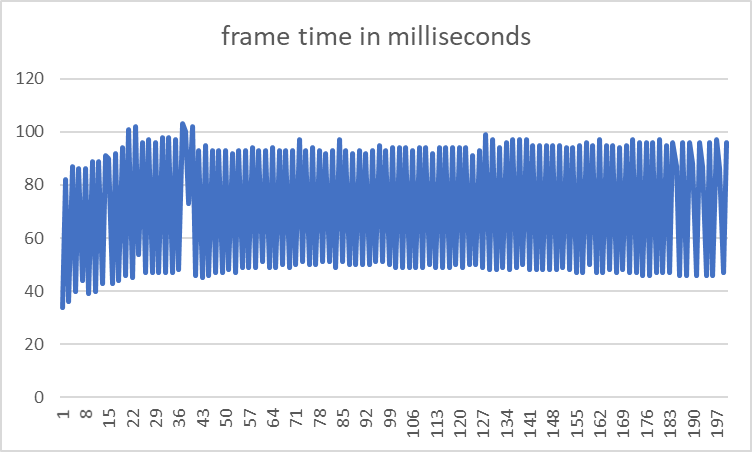
I believe this performance is the result of a bug, which drastically reduces the amount of particles to be rendered, drastically decreasing execution time.
One problem with the code, is that the particle_vector is initialised to contain particle objects. Therefore, each time a derived particle gets constructed, it has to be cast to a particle_object which slows down execution.
The way to solve it is to reduce the number of class types to 1:
Also in this function i didnt like the use of floats for no reason:

And the for loop isnt the most optimal loop to use in this instance:
The performance at this point after implementing a custom allocator, threading, the fixed vector is 87 ms per frame on average. This is not a big improvement since the initial speed. So I wondered why it doesnt seem to change, so I timed what took how long.
I measured the updating of all the 262144 particles which handles spawning, moving, and deleting them:
With activate_particles and process_particles looking like:
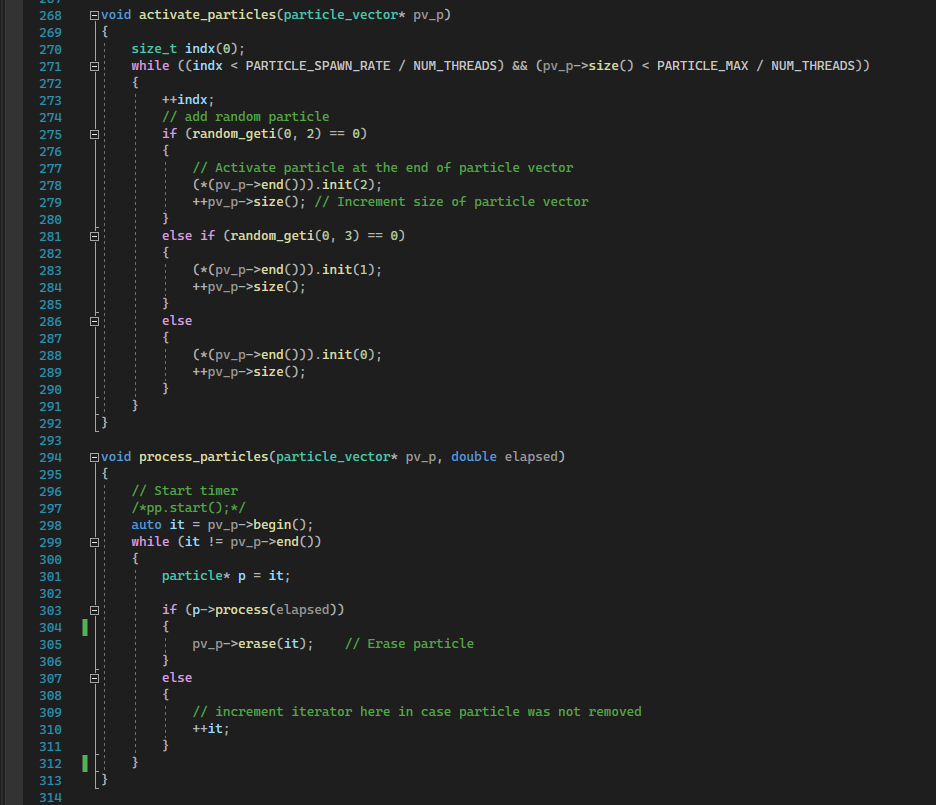
At this point, dynamic memory allocation does not happen within the game loop. All memory has been allocated using the stack allocator, particles are either erased, or initialised within the fixed vectors.

On average this takes 6.345 ms per frame, while rendering took 84.496 ms per frame. As mentioned before, the optimisations and performance recording were done on my home computer which is more powerful than the uni ones. This could have compromised the numbers above or at least skew them to misrepresent what I created here.
I would also like to take some time and explore some other possible methods of optimisation I experimented with, but ultimately not included in this assignment.
The current bottleneck is rendering (duh) but that’s beyond my control, so I will not focus on that. Another aspect of the code that might slow processing down is the creation of threads. I looked into the possibility of threadpooling, where I submit tasks to a pool of threads, and currently inactive threads take on the submitted work. This simulation is essentially made up of 3 sections of code. Activating particles, updating particles, and rendering. As discussed, multithreading rendering is not possible. Therefore, the parralelisable code consists of spawning and updating particles. Both of these sections deal with altering the fixed vectors which contain the particles. Therefore, if multiple threads can alter the same particle vector, the size and elements could become corrupted by the multiple thread access. This could be circuimvented by mutexes, however, that would overly complicate the code and potentially cause unforeseen consequences, making this counterintuitive.
This problem could have been solved with altering the stack allocator, so that it behaves more like a heap, so elements could be deleted from not just the top, but all over. However, this could introduce fractured memory, which would have to be iterated over to find empty spaces, inserting and deleting would get more complicated, and would slow execution down more.
Comments